The polls had systematic error but the model explained them well
[This post was updated May 29, 2019 to reflect the final official results as published by the Elections Committee after the final counting.]
The election is now over and the votes have been counted. We now even have official results and the polls were very clearly off. Indeed, the day after election day in Israel is usually called the pollsters’ “Judgement Day.” As a filler in the minutes leading to the broadcast of the exit polls, the Israeli satire show Eretz Nehederet even aired a skit showing veteran pollster Mina Tzemach chasing the voters who lie to her in the exit polls and using a duck and piñata in lieu of complex statistical models (in Hebrew):
I will discuss the reasons the polls are so often off in Israel in a different post. But here I want to discuss the performance of the model as a guide to understanding the polls.
We might ask - what do we expect of a model? Ideally, we would somehow want the model to predict the most accurate results. But the model’s basic data is always the polls themselves. The model could be adjusted for likely voters, fundamentals, and momentum and trends among undecided voters. But if there is systematic error in the polls, the prediction will likewise be off and any adjustment will only have a minor effect.
In light of this, what we might ask of a model is that it also present us the variability that we can expect. We know what the polls say, but how far from the polls can the actual result be?
Pre-election Poll Errors
A common method of computing poll errors is to use a distance formula, presented here under “Error”:
| Pollster | Publication | Error | B&W-Likud | Likud | Blue & White | Shas | UTJ | Hadash-Taal | Labor | Yisrael Beitenu | Right Union | Meretz | Kulanu | Raam-Balad | New Right | Zehut | Gesher |
|---|---|---|---|---|---|---|---|---|---|---|---|---|---|---|---|---|---|
| Final (PDF) | Election | 0 | 0 | 35 | 35 | 8 | 8 | 6 | 6 | 5 | 5 | 4 | 4 | 4 | 0 | 0 | 0 |
| Midgam Proj. (PDF) | Ch. 13 | 14.64 | -0.8 | 28.4 | 27.6 | 5 | 6 | 6 | 11 | 4 | 7 | 5 | 4 | 4 | 6 | 6 | 0 |
| Smith (Article) | Maariv | 13.42 | 2 | 27 | 29 | 6 | 7 | 7 | 9 | 4 | 6 | 5 | 5 | 4 | 6 | 5 | 0 |
| Maagar Mochot (PDF) | 103FM | 14.49 | 3 | 28 | 31 | 6 | 7 | 7 | 9 | 0 | 7 | 7 | 6 | 0 | 6 | 6 | 0 |
| Panels (Article) | Walla | 13.42 | 1 | 29 | 30 | 5 | 6 | 8 | 10 | 4 | 7 | 6 | 0 | 4 | 6 | 5 | 0 |
| Midgam (PDF) | Ch. 12 | 14.00 | 4 | 26 | 30 | 5 | 7 | 7 | 10 | 5 | 5 | 5 | 5 | 4 | 6 | 5 | 0 |
| TNS (Article) | Kann | 13.11 | -1 | 31 | 30 | 4 | 6 | 8 | 8 | 0 | 6 | 6 | 5 | 4 | 6 | 6 | 0 |
| Smith (Article) | Jerusalem Post | 13.78 | 1 | 27 | 28 | 6 | 6 | 6 | 9 | 5 | 6 | 5 | 5 | 4 | 5 | 4 | 4 |
| Midgam (PDF) | Yediot Achronot | 14.35 | 4 | 26 | 30 | 5 | 7 | 7 | 11 | 4 | 5 | 5 | 5 | 4 | 6 | 5 | 0 |
| Maagar Mochot (PDF) | Yisrael Hayom | 15.23 | 5 | 27 | 32 | 5 | 8 | 6 | 10 | 0 | 6 | 8 | 6 | 0 | 6 | 6 | 0 |
Using a distance formula, the final pre-election polls had errors ranging from 13.11 to 15.23 and averaging at 14.05.
How the Model Performed
With the final results, we can now also compare the model’s forecast to the polls and to another forecast by Knesset Jeremy. For comparison, I’m also adding here the simple average of all pre-election polls:
| Forecast | Error | B&W-Likud | Likud | Blue & White | Shas | UTJ | Hadash-Taal | Labor | Yisrael Beitenu | Right Union | Meretz | Kulanu | Raam-Balad | New Right | Zehut | Gesher |
|---|---|---|---|---|---|---|---|---|---|---|---|---|---|---|---|---|
| Final | 0 | 0 | 35 | 35 | 8 | 8 | 6 | 6 | 5 | 5 | 4 | 4 | 4 | 0 | 0 | 0 |
| Poll Average | 13.34 | 2.02 | 27.71 | 29.73 | 5.22 | 6.67 | 6.89 | 9.67 | 2.89 | 6.11 | 5.78 | 4.56 | 3.11 | 5.89 | 5.33 | 0.44 |
| pyHoshen | 13.34 | 3 | 28 | 31 | 6 | 7 | 8 | 10 | 0 | 6 | 4 | 5 | 4 | 6 | 5 | 0 |
| Knesset Jeremy | 12.17 | -1 | 30 | 29 | 5 | 6 | 7 | 9 | 4 | 6 | 5 | 4 | 4 | 6 | 5 | 0 |
So first, hats off to Knesset Jeremy whose prediction beat all the polls. Its “distance” is 12.17 which is about one mandate less than the closest poll by TNS at 13.11. It was also very close in its prediction that Likud would have a 1 mandate advantage over Blue & White. The Likud sometimes had this mandate depending on the progress of the count, and this mandate is currently being appealed in courts.
But the pyHoshen model’s prediction also was relatively good. We can see this in the graph below:
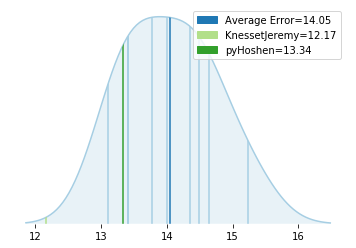
The errors for the various polls are plotted above in blue with the average error of the polls at 14.53 in dark blue. The error of pyHoshen is slightly better than this. In fact, if we take the simple poll-average and compute its error (as in the table above) we get 13.85, very close to pyHoshen’s error.
We can also explain pyHoshen’s conclusions by simply looking at the final polls: The model predicted Yisrael Beitenu would not pass, and this was based on two separate pollsters (Maagar Mochot and TNS) which showed the party below the threshold. It had Raam Balad passing, because most pollsters had them passing. Only one pollster (Maagar Mochot) had them below the threshold. It also had Blue and White passing Likud by 3 mandates. Indeed the average difference is about 2 across the polls.
The Confidence Interval
But, as we mentioned above, if the polls have systematic error it will affect our prediction. But it would be nice to have an indication of how far the true result could differ from the prediction. The model provided such an indication in the form of 95% confidence intervals for the results:
| | Likud | Blue & White | Shas | UTJ | Labor | Hadash-Taal | Yisrael Beitenu | Right Union | Meretz | Kulanu | Raam-Balad | New Right | Zehut | Gesher |
|---|---|---|---|---|---|---|---|---|---|---|---|---|---|---|
| Final | 36 | 35 | 8 | 7 | 6 | 6 | 5 | 5 | 4 | 4 | 4 | 0 | 0 | 0 |
| pyHoshen 95% | 23-34 | 25-36 | 0-10 | 4-11 | 5-14 | 0-12 | 0-7 | 0-12 | 0-9 | 0-9 | 0-8 | 0-11 | 0-10 | 0-5 |
For Gesher and Yisrael Beitenu which were predicted not to pass, the interval was not written on the graph but this is the value it would have computed. Except for the Likud which is 2 mandates beyond the 95% confidence interval, the model has all the final results within its confidence intervals. This is pretty amazing - the model predicts an outcome that is approximately the average of where all the polls lie from the final result. But it also correctly covers (almost) all the final results in its confidence intervals.
At the time it might have seemed the confidence intervals were a bit too extreme – it predicted only four parties to be definitely clear of the threshold! Most pre-election polls were based on about 1000 interviews, and claimed margins of errors ranging 2.5-3.4% - only about 3-4 mandates. (Radio 103FM, the only one based on about 500 interviews, had 4.1% or about 5 mandates). But it’s now clear that having 5 as a low end for Labor, or 34-36 as the high end for Likud and Blue and White was actually necessary. So as a tool to understand the polls, it did very well – giving us the average of the polls but also covering the expected variability.
The model also had Netanyahu’s potential right-wing coalition partners at an average of 66 mandates (as did Knesset Jeremy). This is only one off from the actual results. The total mandates of potential right wing partners for the coalition is at 65 mandates.
Conclusions
The final prediction of the pyHoshen model was based on the polls of 48 days since Feb 21, 2019 when the party lists were finalized. Based on these polls it also computed a correlation matrix and “pollster house effects.” While we do not have any way (independent of the model) to measure these, the correlation matrix did correctly find some conclusions such as the negative correlation between Hadash-Taal and Raam-Balad. It did this simply by analyzing how the various parties’ support varied over time.
It is disappointing that we have such a severe systematic error and as a result such a high variability. The high variability indicating that the Likud was expected anywhere between 25 and 34 or the New Right anywhere between 0 and 11 mandates leave us with much uncertainty. But this is not due to the model which simply told us the correct uncertainty to expect so much as the polls themselves. The polls’ poor performance is a separate issue that has to do with the quality of the polls.
Despite the poor poll performance, we had much better information this year than in previous years as to what the polls actually said due to legal challenges against the polling firms. For example, in previous, parties polled below the threshold would be presented as “0” if at all. This year, the pollsters gave us the support percentage they polled those parties. For example, Yisrael Beitenu got 4.02% and 5 mandates in the final results. Final pre-election polls had it borderline. Some gave it 5 but others gave it 4 or 0. But we also knew that those who polled it at 0 mandates actually had it about halfway to the threshold at 3.25%. Maagar Mochot polled them at 2% while TNS polled them at 2.4%. This is information we simply do not have for previous election cycles and it allowed the model to predict Yisrael Beitenu at a 37% chance of passing the threshold.
So while it is clear and disappointing that the polls were all systematically off, the model was able to provide us with a good understanding of what they mean and what we can expect. The bottom line statements such as the Likud being in position to get between 25 to 34 mandates or Blue & White in position to get between 25 and 36 mandates, and the high chance that Netanyahu will be able to form a narrow right-wing government were correct. It gave us an “average” outcome that correctly summed up the polls, gave us a measure of variability that told us how far we can expect the real results to be, and provided us with a good idea of what kind of coalition we can expect to see.