pyHoshen
Posts
-
A fundamentals component could improve the current model
Note: This post discusses takeaways from 2019. The Final Forecast for 2019 is available and discussed here.
It has been almost two months since the elections. The polls missed quite a few details, indicating a systematic error. However, I was happy with the model - for a polls-only model it captured the both the poll average and gave a good idea of the final result in its margin of error.
I considered adding a fundamentals component. Such a fundamentals model is described here (PDF). A fundamentals model has the potential to improve on the results of a polls-only model.
Read more... -
The polls had systematic error but the model explained them well
[This post was updated May 29, 2019 to reflect the final official results as published by the Elections Committee after the final counting.]
The election is now over and the votes have been counted. We now even have official results and the polls were very clearly off. Indeed, the day after election day in Israel is usually called the pollsters’ “Judgement Day.” As a filler in the minutes leading to the broadcast of the exit polls, the Israeli satire show Eretz Nehederet even aired a skit showing veteran pollster Mina Tzemach chasing the voters who lie to her in the exit polls and using a duck and piñata in lieu of complex statistical models (in Hebrew):
I will discuss the reasons the polls are so often off in Israel in a different post. But here I want to discuss the performance of the model as a guide to understanding the polls.
Read more... -
The 2015 polls were biased against the Likud
Note: This post discusses takeaways from 2015. The Final Forecast for 2019 is available and discussed here.
In a few hours, the exit polls will be published and afterwards we will also have the official count. But it is also interesting to look back and see how well the model did against the 2015 results. I did check my results against 2015 as well as 2009 and 2013. Here are the results for 2015:
Read more...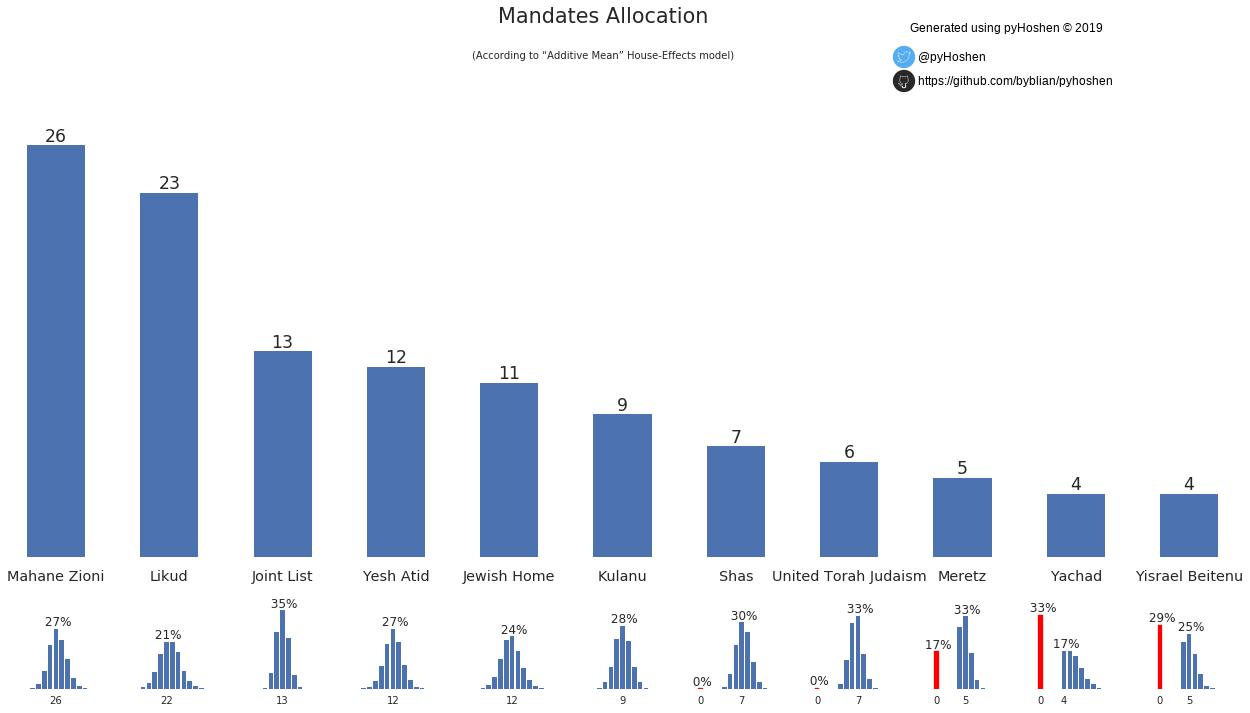
-
Forecasting the Israeli Elections using pymc3
Welcome!
For the political analysis of the final forecast, go here.
This post is a very technical discussion explaining how to run the model and reproduce the results of the final forecast.
Election polls are possibly the clearest and most public example of statistics that we encounter in our lives. We depend on them, as voters (or candidates), to understand where the election stands. They can contribute to tactical voting on the voters’ part, and can influence decisions on the part of candidates and politicians. But what do they mean? How does the margin-of-error figure into the numbers? What are we to understand if two polls have conflicting results?
Read more... -
2019 Election Final Forecast
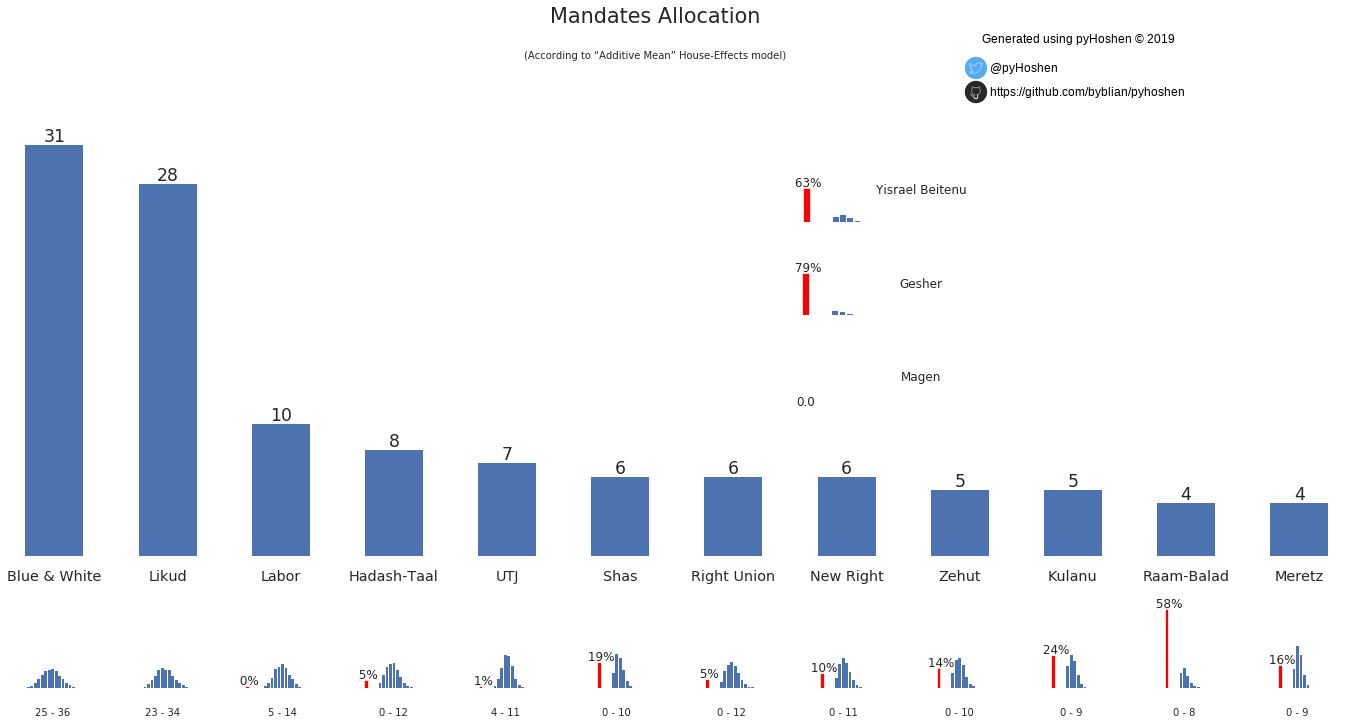
In almost every Israeli election, we have an “election-day surprise.” The polls say one thing - the results come out different. Can we do better?
 (Click to view in full size)
The final forecast has Blue & White doing slightly better than the Likud. Due to the many parties, the high threshold, and the lack of polls up to election day, the uncertainty is high. The only thing that we can say with relative certainty is that the four parties - Likud, Blue & White, Labor, and United Torah Judaism - will be in the next Knesset, while all the rest have some probability that they might fail to make the threshold. Based on the current polls, Likud might get anywhere between 23 and 34, while Blue and White somewhere between 25 and 36. The exact distribution is given below the party mandate bars. The chances any particular party will fail to pass the threshold is given above the small red bar next to it. The range (such as 23 - 34 for Likud or 25 - 36 for Blue and White) is the range of mandates in the 95% confidence interval for the party.
Read more... -
2019 Election Final Forecast - Hebrew
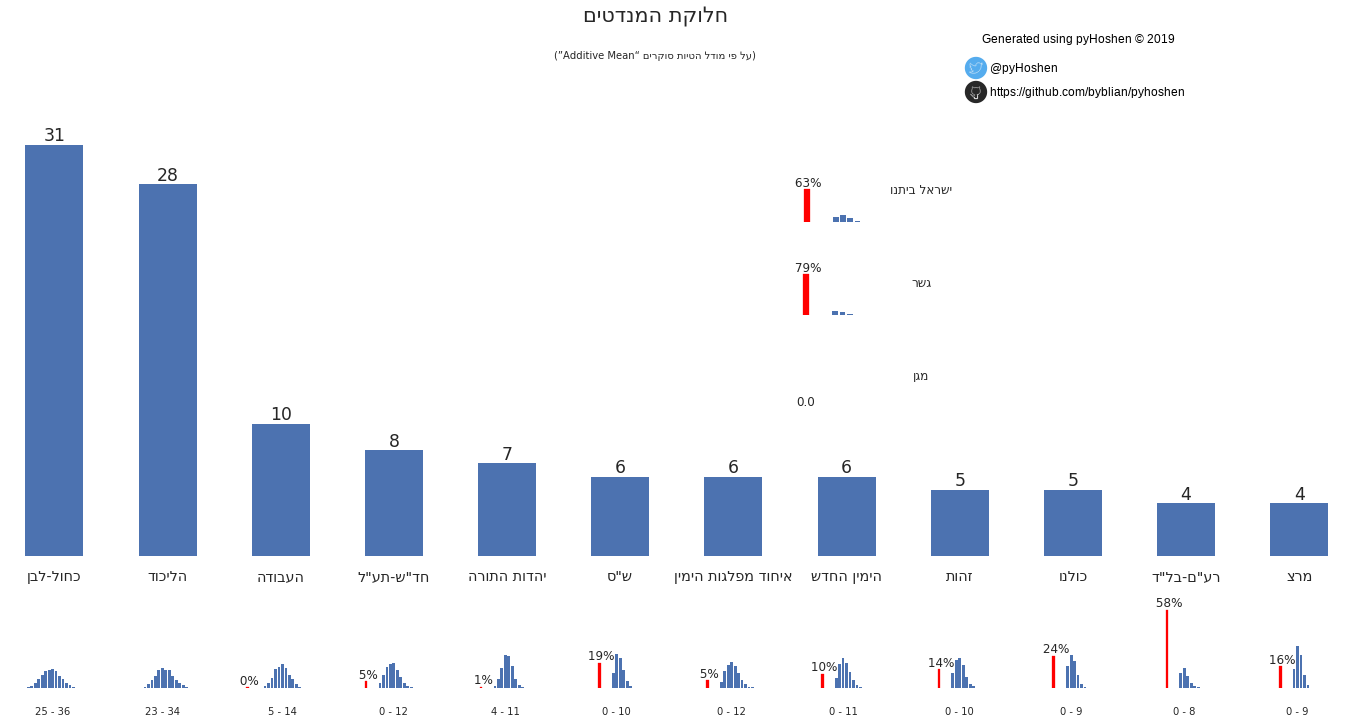
כמעט בכל מערכת בחירות, יש “הפתעת בחירות.” הסקרים אומרים משהו אחד - והתוצאות אחרת. האם ניתן לעשות יותר טוב?
 (לחץ כדי להגדיל)
בתחזית הסופית, כחול-לבן עוקפת את הליכוד במעט. עקב ריבוי המפלגות, אחוז החסימה הגבוה, והעדר הסקרים בימים האחרונים לקראת הבחירות, אי הוודאות גבוהה. הדבר היחידי שניתן לומר בוודאות יחסית היא שארבע מפלגות - הליכוד, כחול-לבן, העבודה, ויהדות התורה - יהיו בכנסת הבאה ,בעוד לשאר המפלגות יש סיכוי מסויים שלא יעברו את אחוז החסימה. על בסיס הסקרים הנוכחיים, הליכוד עלול לקבל בין 23 ועד 34 מנדטים, בעוד שכחול לבן תקבל בין 25 עד 36 מנדטים. ההתפלגות המדוייקת מצויינת מתחת לעמודות המנדטים. הסיכוי שמפלגה מסויימת לא תעבור את אחוז החסימה מצויין מעל העמודה האדומה לידה. הטווח (כגון 23-34 לליכוד או 25-36 לכחול-לבן) הוא טווח המנדטים במסגרת טווח הסמך של 95% לאותה מפלגה.
Read more...