The 2015 polls were biased against the Likud
Note: This post discusses takeaways from 2015. The Final Forecast for 2019 is available and discussed here.
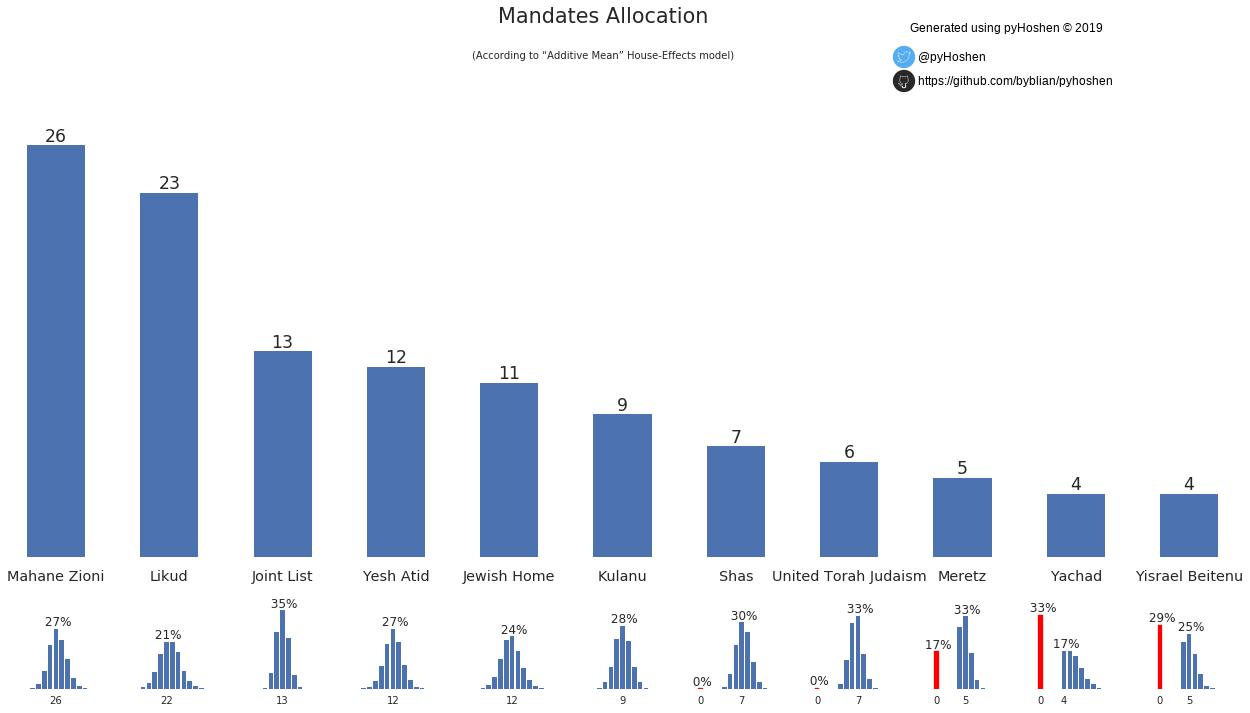
In a few hours, the exit polls will be published and afterwards we will also have the official count. But it is also interesting to look back and see how well the model did against the 2015 results. I did check my results against 2015 as well as 2009 and 2013. Here are the results for 2015:
The Exit Polls
Jeremy Saltan compared the results to the exit polls. The following are the results for the main 3 news channels:
| Exit Poll | Error | Likud | Zionist Union | Joint Arab List | Yesh Atid | Kulanu | Jewish Home | Shas | UTJ | Yisrael Beitenu | Meretz | Yachad |
|---|---|---|---|---|---|---|---|---|---|---|---|---|
| Midgam (Channel 2) | 3.74 | 28 | 27 | 13 | 11 | 10 | 8 | 7 | 6 | 5 | 5 | 0 |
| Midgam Project (Channel 10) | 4.47 | 27 | 27 | 13 | 11 | 10 | 8 | 7 | 7 | 5 | 5 | 0 |
| TNS (Channel 1) | 5.66 | 27 | 26 | 12 | 11 | 9 | 8 | 7 | 6 | 5 | 5 | 4 |
| Panels (Knesset) | 5.29 | 26 | 27 | 13 | 12 | 10 | 9 | 7 | 6 | 5 | 5 | 0 |
| Exit Poll Average | 4.34 | 27.33 | 26.67 | 12.67 | 11 | 9.67 | 8 | 7 | 6.33 | 5 | 5 | 1.33 |
While better than all the forecasts and final polls, the exit poll error (computed as \(\sqrt{\sum diff^2}\)) is around 4-5 mandates. How can we explain this?
In contrast to the final polls (and the forecasts based on them), the exit polls already included any movement of voters who might have switched from Jewish Home or Yachad to Likud. It seems that the campaign polls as well as the exit polls were biased against the Likud by a few percentage points.
One might argue that the polls don’t show the full picture. The exit polls were closed at 20:00 while the actual polls closed at 22:00. Could voters change their minds in the final hours? They could, but it is doubtful it would make a difference. According to official estimates, 62.4% voted by 20:00 and 71.8% voted by 22:00. To make up the difference, about 3.7% of all voters would have had to vote for the Likud in those final two hours. That is about 40% of the voters who voted in those two hours, and almost twice the voters for Likud in total. So while it might have played some part, it also appears that there was a systematic polling error of a few percentage points against the Likud.
The Forecasts
| Poll/Forecast | Type | Error | Likud | Zionist Union | Joint Arab List | Yesh Atid | Kulanu | Jewish Home | Shas | UTJ | Yisrael Beitenu | Meretz | Yachad |
|---|---|---|---|---|---|---|---|---|---|---|---|---|---|
| Knesset Jeremy | Forecast | 10.09 | 22 | 25 | 12 | 12 | 9 | 12 | 7 | 5 | 7 | 5 | 4 |
| pyHoshen (\(e^{-diff}\)) | Forecast | 9.17 | 23 | 26 | 13 | 12 | 9 | 11 | 7 | 6 | 4 | 5 | 4 |
| pyHoshen (\(\frac{1}{diff^2}\)) | Forecast | 10.77 | 22 | 27 | 13 | 12 | 8 | 12 | 7 | 7 | 4 | 4 | 4 |
| Project 61 #1 | Forecast | 8.94 | 24 | 24 | 14 | 10 | 8 | 11 | 8 | 7 | 5 | 4 | 5 |
| Batel Be60 | Forecast | 11.75 | 20 | 25 | 14 | 13 | 11 | 11 | 8 | 6 | 4 | 4 | 4 |
| Midgam (Channel 2) | Poll | 10.39 | 22 | 26 | 13 | 12 | 8 | 11 | 7 | 6 | 5 | 5 | 5 |
| Midgam Project (Channel 10) | Poll | 12 | 20 | 24 | 13 | 12 | 10 | 12 | 7 | 7 | 5 | 5 | 5 |
| Smith (Reshet B) | Poll | 10.58 | 21 | 25 | 13 | 11 | 9 | 11 | 9 | 6 | 6 | 5 | 4 |
| Panels (Maariv) | Poll | 11.13 | 21 | 25 | 13 | 13 | 10 | 11 | 7 | 6 | 4 | 5 | 5 |
Above I include two pyHoshen forecasts - #1 which is the one used in the 2019 final forecast integrates adjacent days using \(e^{-diff}\). Forecast #2 integrates adjacent days using \(\frac{1}{diff^2}\). It was based on the above results that gave Likud a slight boost that I decided to use the \(e^{-diff}\) in the current forecast. pyHoshen is completely new forecasting code. My earlier code in 2015 failed miserably - with a 13.41 error, that used simpler linear regression techniques. Using the correlation matrix and full MCMC modelling were part of my takeaways from this failure.
The forecasts are off by 9-12 whereas the polls are off by 10-12. Some forecasts did better, others worse. But all the forecasts suffered from both the systematic polling error and the “poll blackout” during which voters apparently switched to Likud.